SoylentNews is people
SoylentNews
Submission Preview
Why Uber, DoorDash and Carvana Got Riskier Post Earnings
████ # This file was generated bot-o-matically! Edit at your own risk. ████
Why Uber, DoorDash And Carvana Got Riskier Post Earnings [forbes.com]:
This week I’m featuring three stocks from my Most Dangerous Stocks for Fiduciaries [forbes.com] series that recently reported earnings. This series of reports identified firms with poor fundamentals and valuations that implied unrealistic growth in profits and market share. Each of the firms below remain dangerous for fiduciaries post earnings.
Uber Technologies (UBER), DoorDash (DASH) and Carvana Co. (CVNA) remain in the Danger Zone.
The “Most Dangerous Stocks for Fiduciaries” Got Riskier
The latest earnings reports for the stocks in Figure 1 reveal no real good news and confirm my original Danger Zone thesis for each of them.
Figure 1: Danger Zone Performance: From Date of Publication Through 3/4/21
*Measured from the date of publication (detailed below) of each respective Most Dangerous Stocks for Fiduciaries report.
Uber Still Priced to Take 170% of Total Addressable Market (TAM)
Palantir Technologies Stock Could Fall 17% [forbes.com]98% Of CEOs Say Biden’s Corporate Tax Rate Hike Will Hurt Their Companies, According To Survey [forbes.com]Are Hedge Funds Predicting A Stock Market Crash? [forbes.com]
I named Uber one of the most dangerous stocks for fiduciaries in August 2020 [forbes.com] when I reiterated my original Danger Zone report from April 2019 [forbes.com]. Here’s what I learned from 4Q20 earnings and why the stock is still significantly overvalued.
What’s Working for the Firm: With the COVID-19 induced lockdowns across the country, there were few bright spots for Uber in 2020. The firm’s Delivery Gross Bookings, or the total dollar value of meal deliveries on the platform, grew 110% year-over-year (YoY). The firm’s adjusted EBITDA (which provides a misleading picture of the firms true losses) improved 7% YoY, though remains negative.
In regulatory matters, Prop 22 passed in California, which exempts Uber from classifying drivers as employees. As noted in my August 2020 report, had Prop-22 failed to pass, it would’ve further revealed Uber’s already broken business model of selling a service below cost to gain market share while avoiding paying drivers full benefits to keep costs lower.
What’s Not Working for the Firm: In 2020, overall revenue fell 21% and Gross Bookings fell 11% YoY as well.Despite “structurally lowering its cost case” as CFO Nelson Chai noted in the 4Q20 earnings release, the firm’s NOPAT margin was -28% in 2020 and its return on invested capital (ROIC) was -11%. Uber burned -$6 billion (6% of market cap) in free cash flow (FCF) in 2020 and a cumulative -$30 billion (29% of market cap) over the past three years.
According to data analytics firm Second Measure, Uber’s share of the U.S. rideshare TAM [secondmeasure.com] sits at 68% in January 2021, which is down from 82% in 2017. Uber Eats’ share of the U.S. food delivery TAM [secondmeasure.com] sits at 20% in January 2021, down from 21% in July 2020 and 23% in 2018.
While Uber may have received a regulatory win in the United States, the same cannot be said internationally. In February 2021 The United Kingdom’s Supreme Court ruled [bbc.com] that Uber drivers must be treated as workers, rather than self-employed contractors. Uber claims the ruling focuses on a small number of drivers and has since made changes to its business, but such a ruling could open the door for other countries to take a similar stance and limit Uber’s ability to attract lower cost labor – an essential part of its operating strategy.
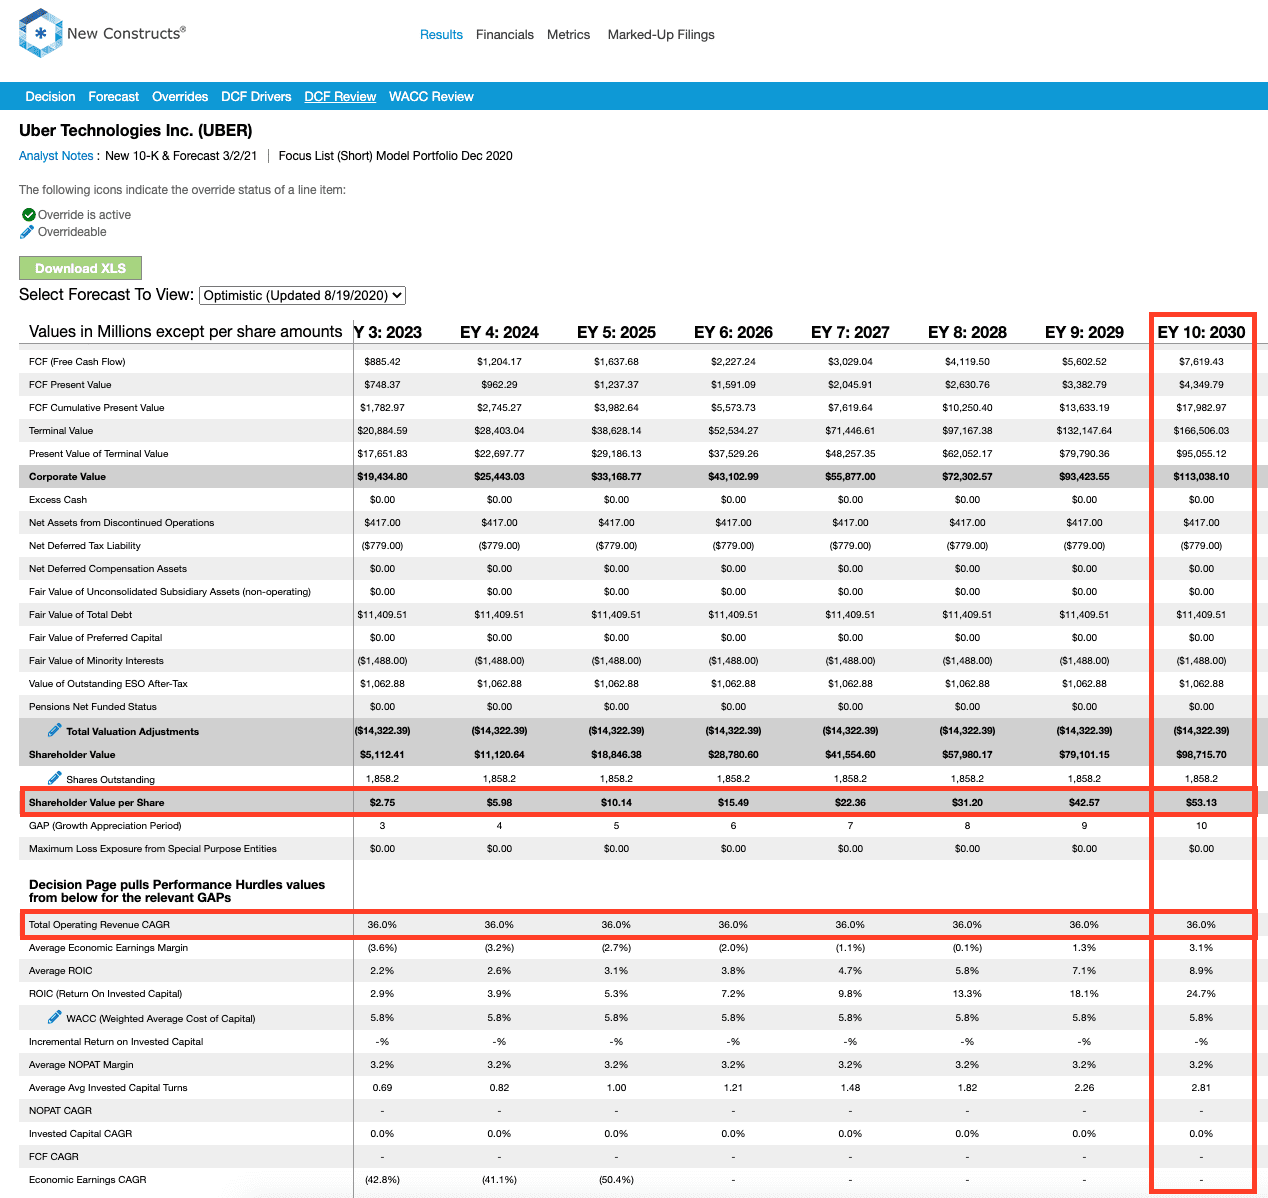
Current Price Implies 170% of 2030 TAM: Given the weakness in its core rides business, continued lack of profitability, and falling market share, I think Uber shares have gotten ahead of themselves (rising ~70% over the past year) and can fall much further. When I use my reverse discounted cash flow (DCF) model [newconstructs.com] to analyze the expectations implied by the stock price, UBER appears significantly overvalued.
To justify its current price of $53/share, Uber must immediately:
- Improve its pre-tax margin to 4% (compared to -34% TTM), which is similar to airlines prior to consolidation and
- grow revenue by 36% compounded annually for the next 10 years.
See the math behind this reverse DCF scenario [newconstructs.com]. In this scenario, Uber would earn $241 billion in revenue in 2030. At its 2020 take rate, this scenario equates to over $1.2 trillion in gross bookings in 2030.
In other words, to justify its current stock price, Uber must capture 170% of the combined projected TAM [newconstructs.com] for rideshare and food delivery in 2030. See Figure 2.
Figure 2 compares the firm’s implied future gross bookings ($1.2 trillion in 2030) in this scenario to its historical gross bookings, along with the expected TAM for rideshare and food delivery in 2030.
Figure 2: Historical Gross Bookings vs. Implied Gross Bookings: 2017-2030
To further illustrate the unrealistically high expectations baked into Uber’s stock price, I compare the implied revenue from the scenario above to the combined revenue of the four largest U.S. airlines and logistics firms FedEx (FDX) and United Parcel Service (UPS) in Figure 3. Uber’s current stock price implies its revenue ten years from now will be 11% greater than the combined TTM revenue of Delta (DAL), American (AAL), United (UAL), Southwest (LUV), FedEx, and United Parcel Service.
Figure 3: Historical Revenue vs. Implied Revenue: 2020 & 2030
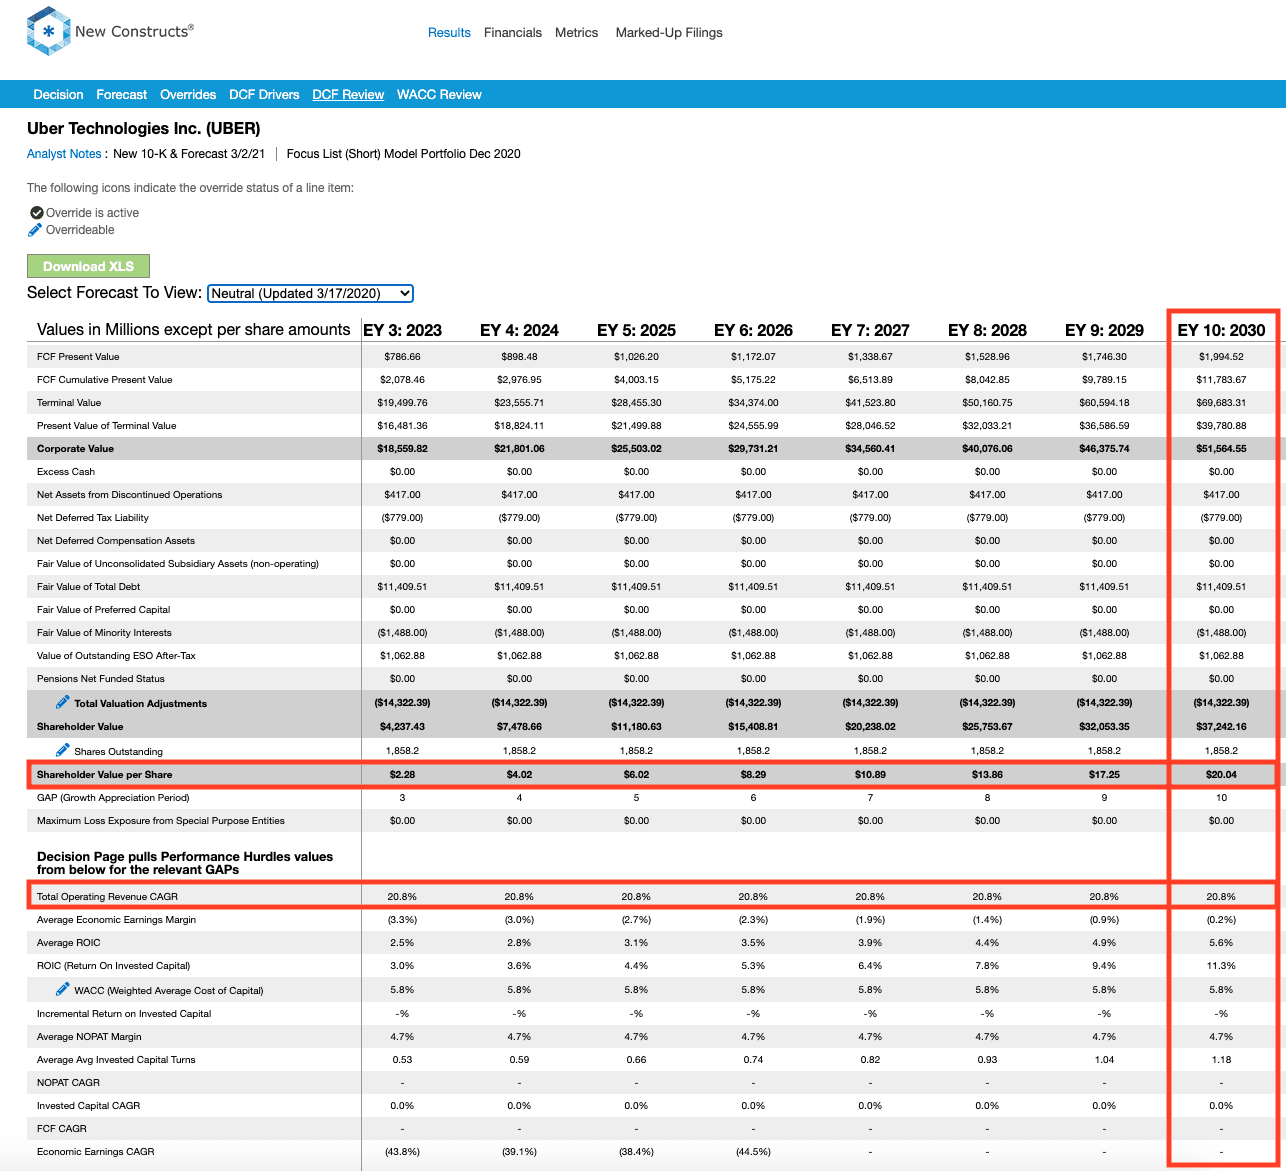
65% Downside Even if Uber Just Meets Analyst Estimates: Uber’s economic book value, or no growth value, is -$37/share, which further illustrates the overly optimistic expectations implied by its stock price.
Even if I assume Uber can achieve a 6% pre-tax margin (greater than pre-consolidation airlines) and grow revenue by 21% compounded annually (in line with average consensus estimates through 2030) for the next decade, the stock is worth only $20/share today – a 65% downside to the current stock price. See the math behind this reverse DCF scenario [newconstructs.com].
Even this scenario seems overly optimistic as it assumes a significant improvement in NOPAT margin and implies Uber’s NOPAT in 2030 would be 43% greater than Southwest Airlines’ 2019 NOPAT.
Each of the above scenarios also assumes UBER is able to grow revenue, NOPAT, and FCF without increasing working capital or fixed assets. This assumption is highly unlikely but allows me to create best-case scenarios that demonstrate how high the expectations embedded in the current valuation are. For reference, UBER’s invested capital has increased by an average of $5.8 billion (52% of 2020 revenue) over the past three years.
DoorDash’s Valuation Implies It Owns 92% of the TAM
I named DoorDash one of the most dangerous stocks for fiduciaries in November 2020 [forbes.com] when I called it The Most Ridiculous IPO of 2020. Here’s what I learned from DoorDash’s first public earnings report and why the stock got riskier.
What’s Working for the Firm: Without a ridesharing business to drag down its food delivery business, à la Uber, DoorDash reported 226% YoY revenue growth in 4Q20 and 2020. The firm’s marketplace gross order volume (GOV) or total dollars spent on the platform increased 227% YoY in 4Q20. The firm’s adjusted EBITDA, which conveniently excludes normal operating expenses (such as legal, tax, and regulatory settlement, reserves, and expenses, stock-based compensation expense, and payroll tax expense), improved from -$103 million in 4Q19 to $94 million in 4Q20.
The rapid revenue growth in 4Q20 helped DoorDash grow its share of the U.S food delivery TAM to 56% in January 2021 [secondmeasure.com], which is up from an estimated [cnbc.com] 33% in 2019.
Just as with Uber, DoorDash also benefits from Prop 22’s passage in California, as it allows the firm to continue to classify drivers as contractors.
What’s Not Working for the Firm: Despite record orders, marketplace GOV, and adjusted EBITDA, DoorDash losses got worse on a GAAP basis. GAAP net income fell from -$134 million in 4Q19 to -$312 million in 4Q20. The lack of any profits raises the question I asked in my original report: if DoorDash can’t generate profits in perhaps the best-possible environment for food delivery, then when will it ever be consistently profitable?
Going forward, DoorDash expects its Take Rate will be negatively impacted by Prop 22, which will require DoorDash to provide healthcare subsidies and payment for driver expenses. Additionally, in its 2021 guidance, DoorDash noted it expects increasing customer churn, reduced order frequency, and slightly smaller average order values beginning in 2020, which will drive down Marketplace GOV in 2Q21 and 3Q21 compared to 1Q21.
GrubHub remains a great example of what to expect from DoorDash’s business as the food delivery market matures. In 2017, GrubHub held ~55% [vox.com] of the U.S. food delivery TAM (excludes restaurants that deliver their own food) and earned a NOPAT margin of 10%. As competition entered the market, GrubHub’s market share fell to 17% in January 2021, and its 2020 NOPAT margin is -5%. DoorDash could see a similar drop in market share if it adopts a strategy that focuses on profits rather than just taking market share.
Given the high level of competition in the food delivery app market, I think it is highly unlikely, if not impossible, for DoorDash to achieve anything close to the market share growth and NOPAT margin improvements baked into its share price.
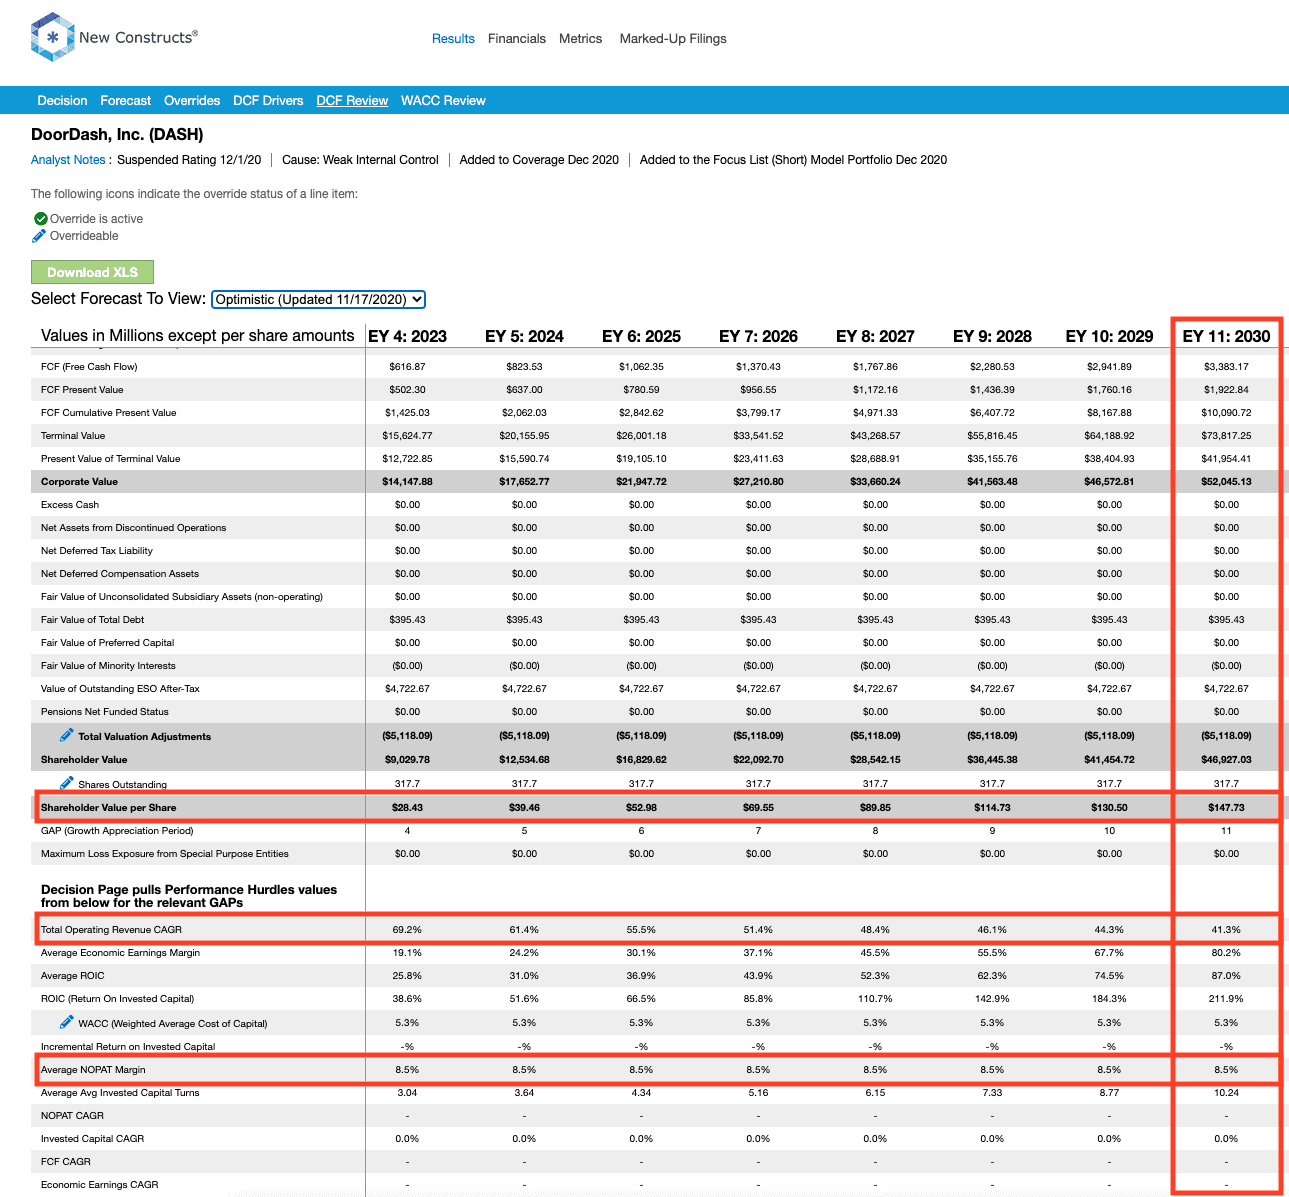
Valuation Implies DoorDash Owns 92% of 2030 TAM: When I use my reverse DCF to analyze the expectations implied by DoorDash’s stock price, I see just how overvalued shares are. DoorDash’s stock price implies huge improvement in both market share and profit margins, two metrics that are unlikely to improve simultaneously in a competitive market.
To justify its current price, DoorDash must:
- Immediately improve its NOPAT margin to 8.5% compared to -67% in 2019 and an estimated -15% in 2020
- 8.5% NOPAT margin is equal to United Parcel Service’s (UPS) 2019 NOPAT margin
- Grow revenue by 41% compounded annually through 2030.
See the math behind this reverse DCF scenario [newconstructs.com]. In this scenario, DoorDash would earn nearly $40 billion in revenue in 2030. At its 2020 take rate, this scenario equates to ~$334 billion in marketplace gross order volume for DoorDash in 2030. Take rate measures the percentage of GOV DoorDash captures as revenue.
In other words, to justify DoorDash’s current price, the firm must capture nearly 92% of the projected 2030 global food delivery TAM, compared to ~30% in 2020. See Figure 4.
Figure 4: Implied Marketplace GOV Grows From 30% in 2020 to 92% of Food Delivery Market in 2030
To further illustrate the expectations baked into DoorDash’s stock price, I compare the implied revenue in the scenario above to its closest peer, Uber Eats, and the largest pizza chain in the world, Domino’s Pizza (DPZ). DoorDash’s current stock price implies its revenue ten years from now will be nearly 10 times greater than the 2020 revenue of either Dominos or Uber Eats, per Figure 5.
Figure 5: Historical Revenue vs. Implied Revenue: 2018-2030
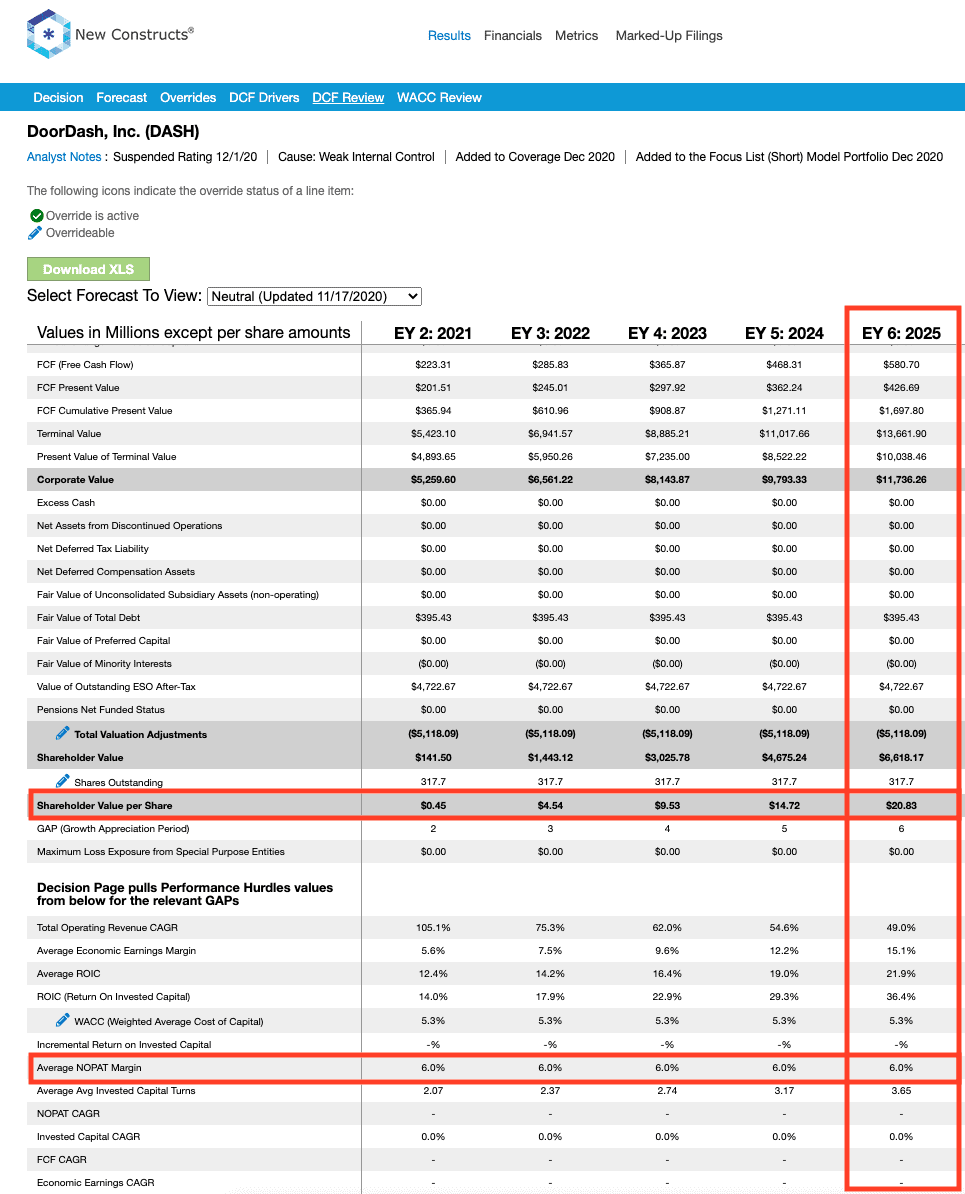
Worth $21/share Even if Analysts Are Right About Growth: DoorDash’s economic book value is -$52/share.
Even if I assume DoorDash can achieve a 6% NOPAT margin (average of logistics providers United Parcel Service and FedEx’s TTM NOPAT margin) and grow revenue to $9.7 billion in 2025 (in-line with average consensus estimates for 2025), the stock is worth only $21/share today – an 86% downside to the current stock price. See the math behind this reverse DCF scenario [newconstructs.com].
Even this scenario seems overly optimistic as it assumes a significant improvement in NOPAT margin (from an estimated -15% in 2020 to 6%) and implies DoorDash’s revenue in 2025 would be more than double Domino’s and Uber Eats’ 2020 revenues.
Each of the above scenarios also assumes DoorDash is able to grow revenue, NOPAT, and FCF without increasing working capital or fixed assets. This assumption is highly unlikely but allows me to create best-case scenarios that demonstrate how high expectations embedded in the current valuation are. For reference, DoorDash’s invested capital increased $813 million (92% of 2019 revenue) year-over-year in 2019.
Carvana’s Valuation Implies It Sells 4x The Cars as the Current Industry Leader
I named Carvana one of the most dangerous stocks for fiduciaries in August 2020 [forbes.com]. Now, with shares trading 22% higher, the stock is even more overvalued. Here’s what I learned from Carvana’s 4Q20 earnings report and why the stock remains too dangerous for fiduciaries.
What’s Working for the Firm: Despite missing EPS expectations in 4Q20, the firm’s revenue grew 42% YoY in 2020. Additionally, the firm’s retail units sold increased 37% YoY, and it opened 120 new markets, which increased its total percentage of the U.S. population served to ~74% (up from 67% in 2019). Double digit revenue growth helped Carvana grow its share of U.S. Used Car Dealers Retail Sales [stlouisfed.org] from 2.9% in 2019 to 3.9% in 2020.
What’s Not Working for the Firm: Despite the record top-line numbers, Carvana’s profitability (or lack thereof) continues to lag peers. The firm’s NOPAT margin sits at -6% and its ROIC at -14%. For reference, CarMax’s (KMX) NOPAT margin sits at 6% TTM and the firm generates a 16% ROIC. Beyond margins, Carvana burned -$1.2 billion in free cash flow (FCF) in 2020, which brings its FCF burn over the past five years to a cumulative -$3.6 billion (7% of market cap).
4Q20 changes nothing about the fact that Carvana is, ultimately, just another used car dealer. However, its marketing and branding as an e-commerce play has driven its valuation to levels that are unsupported by the fundamentals of the business, as I’ll show below.
Valuation Implies Carvana Generates More Sales than All Peers Combined: Despite the negative margins and tougher competition, Carvana is priced as if it will grow larger than the combined revenues of its peer group.
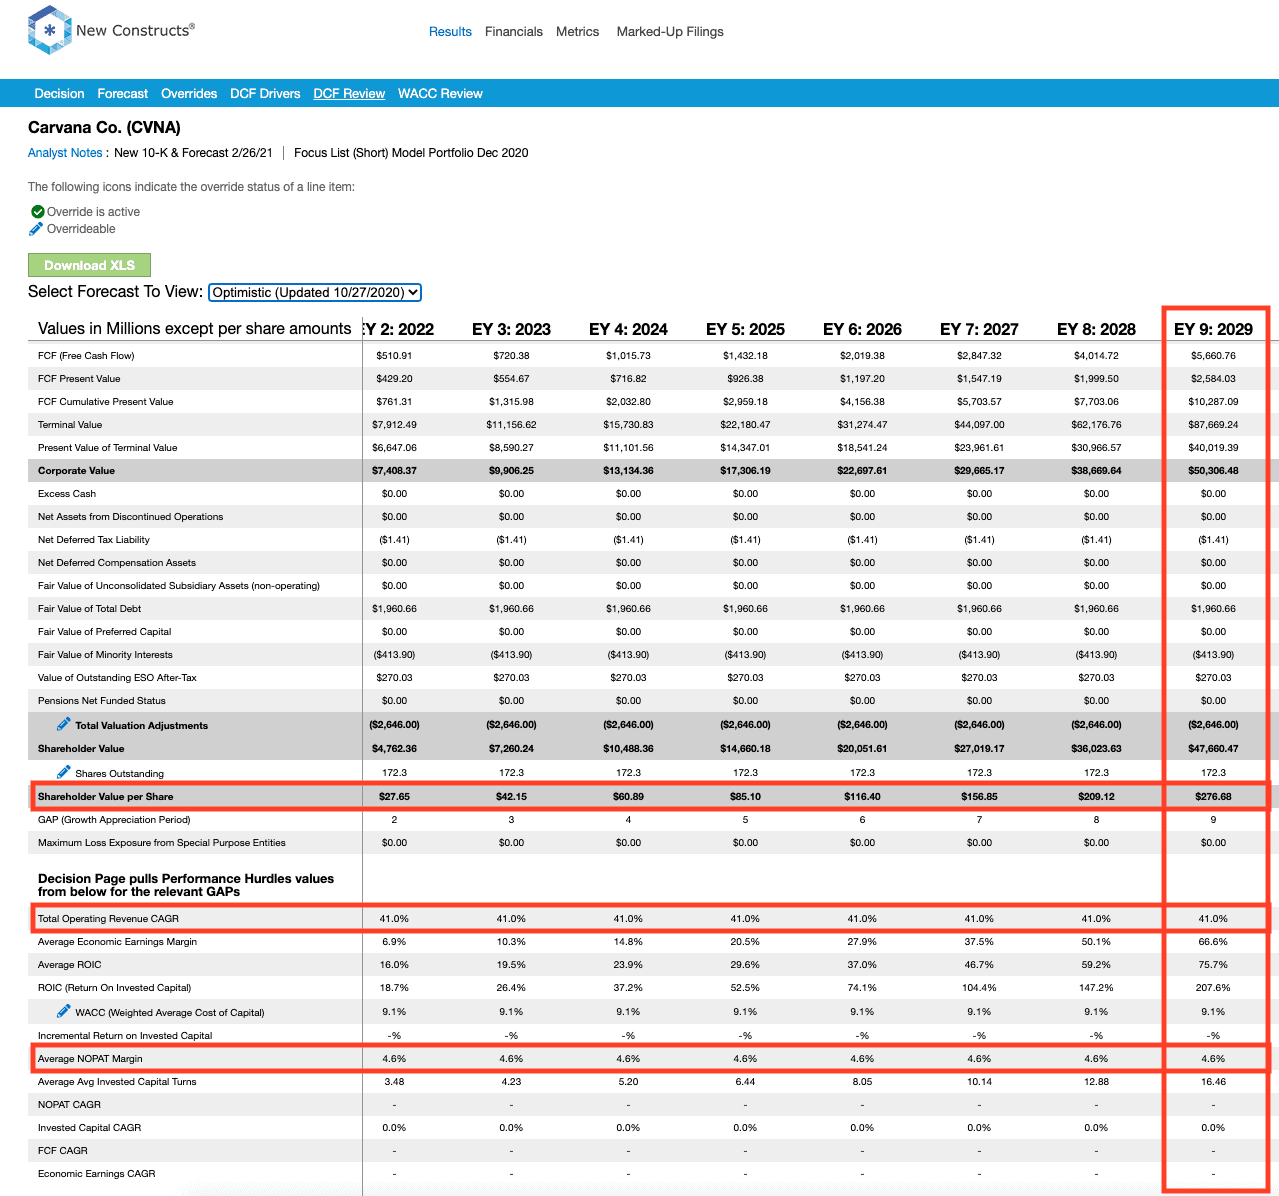
To justify its current price, Carvana must:
- Immediately improve its NOPAT margin to 4.6%, which is equal to its peer group’s[1] TTM margin (compared to -6% in 2020) and
- Grow revenue at 41% compounded annually over the next nine years. For reference, consensus estimates expect revenue to grow 31% compounded annually over the same time.
See the math behind this reverse DCF scenario [newconstructs.com]. In this scenario, Carvana’s revenue in 2029 would reach $123 billion, which is 18% greater than the combined TTM revenue of the peers used in the margin comparison above.
This scenario implies the firm would sell ~4.8 million retail and wholesale vehicles in 2029[2], or over 4x the vehicles sold over the TTM by the largest U.S. used car retailer, CarMax [newconstructs.com] (KMX). See Figure 6.
Figure 6: Historical Units Sold vs. Implied Units Sold: 2018-2029
Significant Downside Even If Carvana Reaches CEO’s Goals: Carvana’s economic book value is -$36/share.
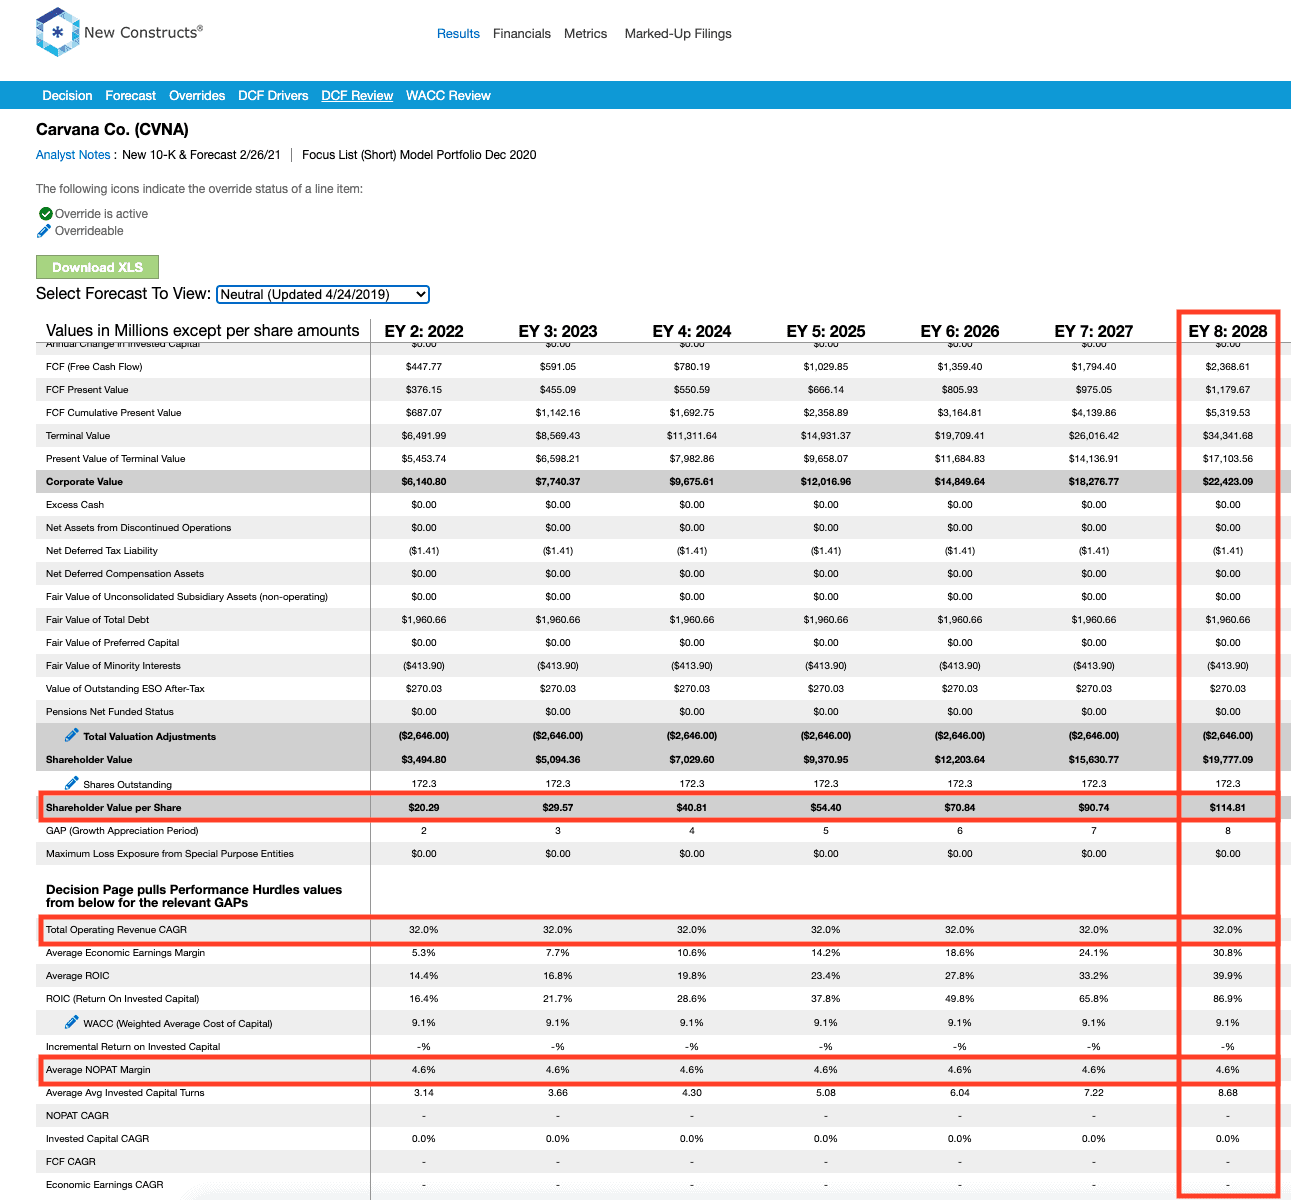
Even if I assume Carvana can meets its stated goal of selling 2 million vehicles per year (nearly double CarMax’s TTM unit sales), shares hold 57% downside from the current price.
In this scenario, I assume Carvana can:
- Immediately improve its NOPAT margin to 4.6% (equal to peer group average TTM margin) and
- Grow revenue by 32% compounded annually for the next eight years (in line with average consensus estimates through 2028)
See the math behind this reverse DCF scenario [newconstructs.com]. In this scenario, Carvana grows NOPAT from -$317 million in 2020 to $2.4 billion (double CarMax’s TTM NOPAT) eight years from now and the stock is worth only $115/share today – a 57% downside.
In this scenario, the firm grows revenue to $51 billion in 2028 and, assuming Carvana generates ~$25 thousand per vehicle sold (using same assumptions listed in prior scenario), the firm would sell 2.1 million vehicles in 2028.
The Real Earnings Season Is Here
While the traditional quarterly earnings season may be winding down, the real earnings season [forbes.com] – 10-K filing season – is just getting started. Traditional, unscrubbed earnings for U.S. stocks are off by an average of ~20% [newconstructs.com]. Investors deserve more reliable fundamental research based on rigorous analysis of the footnotes and MD&A. My firm’s Core Earnings give investors a more reliable measure of a firm’s profitability and valuation by removing all the unusual items that distort unscrubbed data from other providers. My firm’s proprietary, adjusted fundamental data supports my research into Danger Zone picks such as Uber, DoorDash, and Carvana.
Disclosure: David Trainer, Kyle Guske II, and Matt Shuler receive no compensation to write about any specific stock, sector, style, or theme.
[1] Peer group includes America’s Car-Mart (CRMT), Asbury Automotive Group (ABG), AutoNation (AN), CarMax (KMX), Cars.com (CARS), Group 1 Automotive (GPI), KAR Auction Services (KAR), Lithia Motors (LAD), Penske Automotive Group (PAG), Sonic Automotive (SAH), and TrueCar, Inc. (TRUE).
[2] Calculated by taking the implied revenue divided by the implied revenue per vehicle. In 2020, Carvana generated a total of $5.6 billion in revenue and sold 299 thousand combined retail and wholesale vehicles, which equates to ~$18.7 thousand in revenue per unit sold. Assuming inflation of 3.5% per year, revenue per unit sold in 2029 would be ~$25.4 thousand.
Follow me on Twitter [twitter.com]. Check out my website [newconstructs.com].
- Reprints & Permissions [parsintl.com]